About this chapter
The goal of this chapter
To gather deep, on-the-ground information about side streams and how your value chains and supply chains function, understand what makes side streams valuable, prioritize where to focus your initial time and resources for maximum impact toward a 100% ecosystem, and identify your early 100% Champions.
- Gather deep, on-the-ground information about your side streams and how your value chains and supply chains function.
- Understand the biological and functional properties that make seafood side streams valuable.
- Prioritize where to focus your initial time and resources for maximum impact.
- Identify the early 100% Champions already in your ecosystem, and connect with them.
What you'll learn, in four parts
Deep, on-the-ground information about your side streams
Why this is important: Different species and different processing flows will lead to different types of side streams in differing volumes, and different parts of seafood can have different characteristics, all of which inform the products and business models that might emerge. It is also important to know what value, if any, is already being created from side streams in your ecosystem, and what is currently holding 100% back.
Go to part 1 ↓What are the biological and functional properties that make seafood side streams valuable?
Why this is important: It is essential to understand the biological and functional characteristics of the seafood biomasses we are working with, as this will help us identify the potential products and markets to explore.
Go to part 2 ↓How to prioritize where to focus your initial time and resources for maximum impact
Why this is important: At the beginning of the development of 100% ecosystems, time and resources are likely to be limited, so it is critical to identify where to most impactfully spend that time and those resources to further utilization and valorization in your ecosystem, starting with the lowest-hanging fruit.
Go to part 3 ↓Identifying early 100% Champions
Why this is important: In almost every ecosystem, some form of full utilization is already happening. Highlighting and lifting up these first champions is a key step in building momentum: you are not just bringing in an idea from outside, but building from the grassroots and connecting with the unique context and heritage of your own ecosystem, as well as a future growth opportunity.
Go to part 4 ↓
Learn and apply
Part 1 · Every part counts
The previous chapter covered key concepts of where you find the volumes of seafood, which species are present in your ecosystem and which of them are key or high-value species.
The next stage of this discovery is to understand what happens to different species on the ground and in the processing facilities:
These are the general questions to understand across most ecosystems. They support the first stage of prioritizing: what value can be created, and where the low-hanging fruit is.
What exactly is the process of taking the fish from farm or vessel to processing?
- How have the fish been handled since they left the water, for example how they were cooled, and what is their quality?
- Is any pre-processing done before the fish reach the facility, such as heading, bleeding or gutting?
- What volumes are landed where, and how fragmented are the landings?
- Are there challenges on the vessel or farm that limit quality or handling options?
How is the fish handled, processed, stored and transported?
- What is the level of automation, compared with manual labor?
- What are the processing steps, and which parts of the fish or shellfish are separated when? Do they go into separate containers, and what are the containers made of? Are they food grade under your region’s regulations?
- If material goes to landfill or recycling, what is it costing the company?
- Is a value chain step already in place for any of the side streams, and what are its margins today?
To find the answers, it is vital to go and visit the processing facilities and speak to the processors directly. Don’t go in with a lot of assumptions: go in to listen and learn, because they are the experts in processing their species.
This is a key stage in information gathering but, perhaps even more importantly, in dialogue and relationship building.
Every country, species, market and processing facility will have unique characteristics. Even facilities processing the same thing may do things slightly differently: they may use different levels of automation, separate different parts of the seafood at different points, and collect material in different ways, which affects what it can be used for next.
Walk the floor
Imagine you are walking around the four imaginary processing facilities below. As you go, ask yourself:
- What questions would you ask them?
- What would you make a note of?
- What value could already be created, without major changes to the way the seafood is processed and without big investments in new equipment?
Above all: what are the easy wins that could build momentum, and trust, for 100%?
- High volumes, separated parts and cold storage all suggest that products from food grade right up to biomedical development are likely possible.
- The volume of each part will be very important, and raises specific questions about the biological profile of each part on its own.
- Processing is highly automated, so the data here is likely very consistent: worth considering how that supports developing a business case.
- The biggest considerations: which value chains do these materials already go to, and how well do those products fit the company’s overall brand and value chain positioning?
Here are a few links to see just how this looked in practice in the Great Lakes: 100% Whitefish Report, Multi-Species Report and 100% Great Lakes Fish Market Demand Report (PDFs).
- The primary fillet is the focus of all flow in the facility, and “waste” is primarily gathered in mixed bulk from multiple species.
- It has a value stream, but a low-value one, to mink feed, which means the handling is animal-feed grade rather than human-grade. To work with these side-stream biomasses for any high-value applications, the primary thing that would need changing would be the way in which this biomass is stored (e.g. cooling or drying) and, ideally, the separation of elements such as viscera.
- Note, though, that since this facility relies on hand-filleting, the fish are de-scaled prior to further processing, so the scales are already a clean, separated biomass that is a potential low-hanging fruit for the accessibility of this material.
- Scales are interesting for a number of reasons, e.g. mineral content, collagen peptides, iridescent properties for natural colorants. What will be key to understand for these scales is the composition, the volume (either from this facility alone or from collaborating facilities) and the market demand.
- Here are a few links to see just how this looked in practice in the Great Lakes: 100% Whitefish Report, Multi-Species Report and 100% Great Lakes Fish Market Demand Report (PDFs).
- The scallops were primarily processed by hand, with a delicate and skilled task to remove the scallop meat from the shell. The meat itself was then moved into more automated processing and packaging.
- The frills of the scallop went to Cat 3 (non-human-grade) tubs on the floor. The orange gonad was separated into a separate tub to start with, but then combined with the frills.
- Some flat top shells were donated to local farmland as a mineral supplement, and some curved lower shells were sold for decorative ornaments. The remaining shells, frills and gonads were collected for a fee by a waste company.
- Things to notice here are the points of separation and the cost of actually having biomass taken away for waste collection. This gives a clear metric to improve from in value creation pathways.
From Oregon State University Extension: Learn how pink shrimp are caught (video).
- Shrimp are landed from the harbor and vessel to the processing facility, and cooked in brine water. This brine water then becomes rich in e.g. proteins, which have potential value.
- The shells are then often removed. In some cases these shells are sold or donated to agriculture because of their nitrogen and phosphorus content, and in some cases these shells go to landfill, but they are increasingly being examined for properties like protein and chitosan.
- From Oregon State University Extension: Learn how pink shrimp are caught (video).
Hover over each example of a processing facility to see what particular elements you might pay close attention to in this case and what specific questions to consider.
- High volumes, separated parts and cold storage all suggest that products from food grade right up to biomedical development are likely possible.
- The volume of each part will be very important, and raises specific questions about the biological profile of each part on its own.
- Processing is highly automated, so the data here is likely very consistent: worth considering how that supports developing a business case.
- The biggest considerations: which value chains do these materials already go to, and how well do those products fit the company’s overall brand and value chain positioning?
- The primary fillet is the focus of all flow in the facility, and “waste” is primarily gathered in mixed bulk from multiple species.
- It has a value stream, but a low-value one, to mink feed, which means the handling is animal-feed grade rather than human-grade. To work with these side-stream biomasses for any high-value applications, the primary thing that would need changing would be the way in which this biomass is stored (e.g. cooling or drying) and, ideally, the separation of elements such as viscera.
- Note, though, that since this facility relies on hand-filleting, the fish are de-scaled prior to further processing, so the scales are already a clean, separated biomass that is a potential low-hanging fruit for the accessibility of this material.
- Scales are interesting for a number of reasons, e.g. mineral content, collagen peptides, iridescent properties for natural colorants. What will be key to understand for these scales is the composition, the volume (either from this facility alone or from collaborating facilities) and the market demand.
- The scallops were primarily processed by hand, with a delicate and skilled task to remove the scallop meat from the shell. The meat itself was then moved into more automated processing and packaging.
- The frills of the scallop went to Cat 3 (non-human-grade) tubs on the floor. The orange gonad was separated into a separate tub to start with, but then combined with the frills.
- Some flat top shells were donated to local farmland as a mineral supplement, and some curved lower shells were sold for decorative ornaments. The remaining shells, frills and gonads were collected for a fee by a waste company.
- Things to notice here are the points of separation and the cost of actually having biomass taken away for waste collection. This gives a clear metric to improve from in value creation pathways.
- Shrimp are landed from the harbor and vessel to the processing facility, and cooked in brine water. This brine water then becomes rich in e.g. proteins, which have potential value.
- The shells are then often removed. In some cases these shells are sold or donated to agriculture because of their nitrogen and phosphorus content, and in some cases these shells go to landfill, but they are increasingly being examined for properties like protein and chitosan.
Understand the chains a processor is already part of
Just as important as the processing floor are the supply chains and value chains a processor is already part of. They show where the fish and its parts go today, through whose hands and where value is added, and so where a side-stream product could fit and who would need to be part of it.
Supply chain: how the fish physically moves, from the water to the customer. Here, Atlantic cod.
Value chain: where value is added along the way. Here, Atlantic cod whose skins, a side stream, go to collagen.
Seafood supply chains can get very complicated, particularly where there are multiple vessels, multiple landing sites and side-stream development.
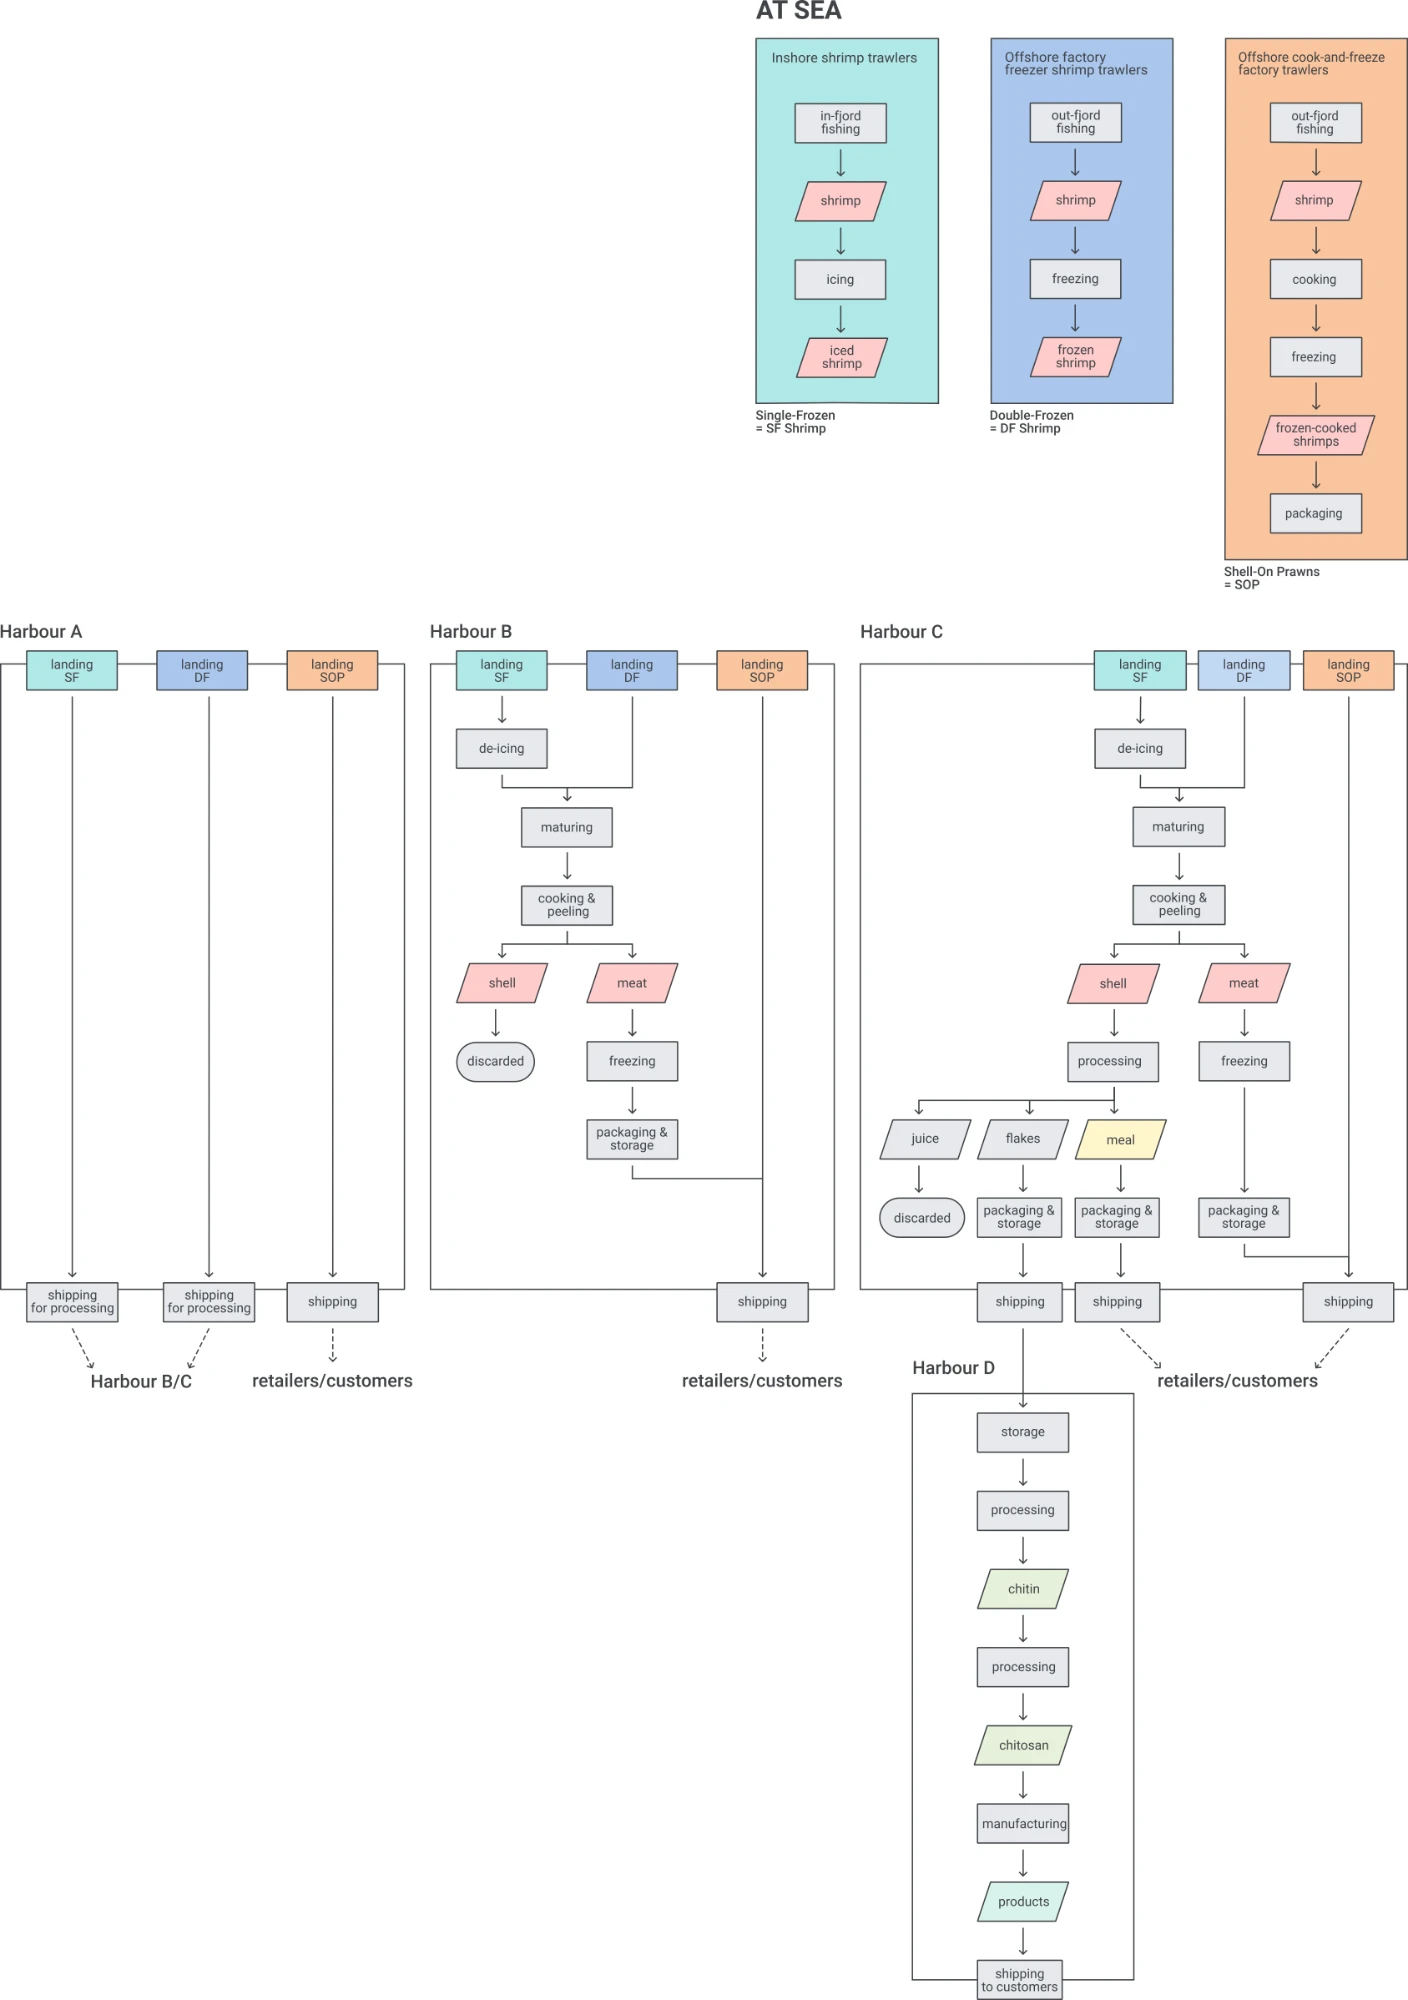
Map your own. Two simple tools draw a simplified supply chain or value chain for your own ecosystem, step by step, ready to download.
This can highlight key gaps and opportunities for new gains in efficiency or value creation, and can help you understand the challenges the processors might have in making steps toward 100%.
Once you have the numbers for volume, and know which parts are going where, how they are stored and why, this can already indicate where you should spend initial focus time and dive deeper.
- High volume in a single location.
- Significant cold storage.
- Separated or highly accessible from the existing processing chain.
- Potential uptake present with interest in a certain material or volume.
- Biomass or part that is well characterized with a known market.
- Biomass that is costing the processor significant money to remove.
- A clear local demand for a particular biomass.
More on prioritizing in Part 3.
Part 2 · What are the biological and functional properties that make seafood side streams valuable?
What is the potential value, function and market for your material?
To answer this key question, you need to know the biological composition and functional properties of your material. This is the stage where the knowledge of someone with biological, biochemical or nutritional expertise becomes invaluable.
For common species, and species that are well studied in the seafood sector, significant data on composition usually exists already, at least for the primary material: it is likely destined for food or feed, where its nutritional composition is known.
What is your material made of?
- Step 1
Scour the existing peer-reviewed and formal literature for what is already known. This will save you a lot of time and money compared with Step 2, and let you be much more selective about which compositional elements are most important to analyze first.
- Step 2
Send the most interesting volumes or materials, where there are compositional unknowns, for biological analysis.
Keep it narrow to keep the cost down. That takes experience, but it can be important. If only the primary biomass, such as the fillet, has a known composition, it can indicate what might be of interest in other parts of the fish; likewise, similar species can offer clues for narrowing down which parameters are of interest for other species and parts of the fish.
From composition to function
- Step 1
Start with secondary data sources, where they already exist. Always start by searching what is already known, to avoid doubling cost and effort unnecessarily. Check out the link below to get you started with some key peer-reviewed literature linked to the biology and function of seafood side streams.
- Step 2
Analyze, but selectively: choose what to analyze based on what you already know about the material’s indicative composition, its accessibility and its supply chain.
We have created an indicator tool to support your first thinking on which compositional and functional traits of broad seafood groups might translate into which types of value, and even which business models. (More on the business models of 100% champions in chapter 4.)
Part 3 · Prioritizing where to start
The 100% Prioritization Matrix Tool helps you identify which side-stream-to-end-product value chains to prioritize in your local context, so you avoid chasing high-value products that don't match local supply, or defaulting to low-value uses. Each candidate chain is scored from 1 to 3 on six dimensions:
- Side-stream availability3 = year-round, steady volume
- Side-stream fragmentation3 = easy to aggregate
- Market attractiveness3 = high-margin demand
- Capital intensity3 = SME-friendly entry
- Infrastructure maturity3 = ready-to-use logistics
- Regulatory complexity3 = clear, fast approvals
Each side-stream-to-end-product chain is scored 1–3 on six dimensions: center = 1 (low opportunity), outer ring = 3 (high).
Navy and orange are two example chains with illustrative scores, compared side by side as in Step 4.
With the how-to guide, you can run the 100% Prioritization Matrix Tool step by step in your own system, as a full deep dive: it does require significant data gathering, expertise in policy, regulation, innovation and biology, and strong connectivity in the region.
A quick-shot version of the matrix, not as in-depth as carrying out the work directly with the how-to guide.
Part 4 · Identifying early 100% Champions
Somewhere in your ecosystem, 100% is probably already happening.
It may be small-scale, it may not be well known, and it may be considered fairly low value, but in almost every ecosystem there is something that is clearly a first champion: an example of 100% in action.
Highlighting and lifting up these champions is a key step in building momentum. It means you are not just bringing in an idea from outside your ecosystem: you are building from the grassroots, connecting with the unique context and heritage of your own ecosystem, and with a future growth opportunity.
Meet a few champions that were already there: hover over or tap a place on the map, or choose one above it.
Lýsi
Lýsi has been making cod liver oil in Reykjavík since 1938, long before the Iceland Ocean Cluster.
lysi.comAlaSkins
Local entrepreneur AlaSkins was an early 100% Champion in Alaska. Since 2017, its founder, Sara Erickson, has turned discarded salmon, halibut and cod skins into pet treats, food products, oil and skincare.
Read Sara Erickson's story →The Reclaim Cooperative
A school education project, in which a yak hide tanner trialled fish skin leather, has led to the Reclaim Cooperative, now making fish skin leather in Oregon.
reclaimcoop.comIndigenous reservations
Full utilization on Indigenous reservations around the Great Lakes, where fish side streams become agricultural compost.
Again, this discovery is as much about building relationships as building knowledge. Get out there, and speak and connect with the 100% Champions already present in your ecosystem: they will be a key foundation for the development of your community and its momentum. Remember the processors, the entrepreneurs and the fisheries: all can be great sources of 100% Champions.
Your champions lead straight into chapter 4: showcasing the 100% opportunity, the opportunity in your own ecosystem, its existing 100% Champions, and the next steps to create more value and less waste, all based on the tangible information you have already gathered.
In practice
Three places, three different answers
Same framework, very different results
The 100% Prioritization Matrix Tool was built and validated across two geographically, economically and ecologically distinct regions, with the Scottish Ocean Cluster and the Oregon Ocean Cluster. The same framework produced very different results in each.
Scotland
Landings dominated by Mackerel, Haddock, Cod, Scallops and other whitefish. The matrix identified Calcium Carbonate (from scallop shells) and Fish Oil for human consumption as the priority chains.
Key learnings
- Many side streams are already used, mostly as fishmeal for salmon aquaculture, so the task is creating higher-value alternatives without disrupting that market.
- New organic waste rules made shellfish side streams, such as langoustine shells, an immediate priority.
- A stakeholder-first approach turned the findings into five focus areas, with the matrix as an ongoing reference.
Oregon
Large-volume landings including Pacific Whiting, Pink Shrimp and Dungeness Crab. Pink Shrimp shells were the strongest opportunity, and Fish Oil and Chitosan were identified as the priority chains.
Key learnings
- Most other primary species are sold whole or minimally processed, which limits the side-stream volumes available.
- Smaller-scale opportunities, like fish leather, warrant a separate assessment at higher resolution.
As these two examples show, the tool is designed to respond to local context. On-the-ground knowledge is what makes its output valuable.
Shrimp side streams in a remote community
The matrix was used to compare ten ways of using shrimp processing side streams in Sisimiut, a remote town in Greenland, from composting and incineration to protein hydrolysates and chitin and chitosan. The tool was adapted to the local context, and the highest-ranked pathways, by their weighted prioritization scores, were protein hydrolysates (60), chitin and chitosan (55), incineration (51) and shrimp meal (44).
Key learnings
Weight the dimensions to fit the case.
With plenty of biomass in one place, availability and fragmentation scored high for every option, so market attractiveness was weighted most heavily (40%).
Match the processing to the location.
Where advanced processing and expertise are limited, pre-processing locally and exporting an intermediate product can be the realistic first step.
Add community value.
Each pathway was also assessed for local jobs, energy security and small business opportunities, alongside commercial feasibility.
The best options work together.
The top pathways are complementary: a cascading biorefinery could extract proteins first, then chitin and chitosan, and use the remaining biomass for energy.
Learning from the Great Lakes
Reflection · Great Lakes 100% Fish InitiativeAdapting 100% Fish to a fragmented freshwater regionRead
The Conference of Great Lakes St Lawrence Governors & Premiers (GSGP) set out to adapt the 100% Fish model to one of the world's most complex freshwater seafood economies: eight US states and two Canadian provinces, no single dominant species, and a supply chain made up of many independent actors. Rather than importing a ready-made model, GSGP started by understanding the whole system, mapping biomass and by-products, testing regional species and studying markets, before making practical recommendations. Its 100% Great Lakes Fish Pledge now brings together nearly 50 signatories, representing around 90% of the region's commercial catch.
For other ecosystem leaders, the lesson is to adapt principles rather than copy structures, invest in foundational research, and build trust before infrastructure. Years of showing up in person, a shared public commitment and deliberate storytelling turned early skepticism into a regional coalition, and identified opportunities worth an estimated CAD 30 million a year from biomass that was once treated as a disposal cost.
Know your side streams, choose where to start, and find your first champions
- Go deep, on the groundVisit the processing facilities and listen and learn from the processors, not with assumptions: they are the experts in their species. Note where parts are separated and what waste costs them, build relationships, and understand the supply and value chains they are part of.
- Know what it's made ofAsk what the potential value, function and market of your material are. Scour the literature first, then analyze only the most interesting unknowns, ideally with biological, biochemical or nutritional expertise.
- Prioritize with local knowledgeTime and resources are limited at first, so score side-stream value chains on six dimensions, with local data and stakeholder interviews; a chain that scores high and even is a strong place to start. Local context decides: adapt the principles, don't copy.
- Find your first championsSome form of 100% is most likely already happening in your ecosystem. Lift up its first champions to build momentum from the grassroots, and get out and connect with them, from processors and entrepreneurs to fisheries.
Read the full TL;DR
Building on chapter 2's picture of where your seafood volumes are and which species are key, gather deep, on-the-ground information about your side streams and how your value chains and supply chains function: how the fish gets from farm or vessel to processing, and how it is then handled, processed, stored and transported. The same general questions apply across most ecosystems, from cooling, pre-processing and how fragmented the landings are to automation, how parts are separated and contained, what landfill costs and what margins existing value chains make: they are the first stage of prioritizing, and show where the low-hanging fruit is. To find the answers, it is vital to visit the processing facilities and speak to the processors directly: don't go in with a lot of assumptions, but go in to listen and learn, because they are the experts in processing their species. This is a key stage in information gathering and, perhaps even more, in dialogue and relationship building. Every country, species, market and processing facility will have unique characteristics: even facilities processing the same thing may use different levels of automation, separate different parts at different points and collect material in ways that affect what it can be used for next, as four example processing flows show, from Icelandic cod to Oregon pink shrimp (a highly automated cod line with separated parts and cold storage, for example, points to products right up to biomedical development; a hand-filleting whitefish facility sends its mixed cut-offs to low-value mink feed, but its scales are already a clean, separated biomass; a scallop processor that pays a waste company to take away its remaining shells, frills and gonads has a clear metric to improve from; and in pink shrimp processing the cooking brine becomes rich in proteins, while the shells, sold or donated to agriculture or sent to landfill, are increasingly being examined for protein and chitosan): look for the easy wins, possible without major changes or big investments, that build momentum and trust for 100%. Different species and processing flows lead to different types and volumes of side streams, and different parts of seafood have different characteristics, all of which inform the products and business models that might emerge. Find out, too, what value, if any, is already being created from side streams in your ecosystem, and what is holding 100% back. Just as important are the supply chains and value chains a processor is already part of: how the fish and its parts move from the water to the customer, and where value is added along the way, as in the example of Atlantic cod whose skins go to collagen. They can highlight key gaps and opportunities for new gains in efficiency or value creation, and the challenges the processors might have in making steps toward 100%. Supply chains can get very complicated, particularly with multiple vessels, multiple landing sites and side-stream development, as a Greenlandic shrimp example shows; two tools help you map simplified supply and value chains of your own. Once you have the numbers for volume, and know which parts go where, how they are stored and why, you can already see where to spend your initial focus and dive deeper: high volume in a single location, significant cold storage, parts that are separated or highly accessible from the processing chain, potential uptake, a well-characterized biomass with a known market, biomass that costs the processor significant money to remove, or a clear local demand.
It is also essential to understand the biological and functional characteristics of the seafood biomasses you are working with: they help you identify the potential products and markets to explore. The key question is the potential value, function and market of your material, and answering it takes knowing its biological composition and functional properties, ideally with someone with biological, biochemical or nutritional expertise. For common, well-studied species much is already known, at least for the primary material, so first scour the peer-reviewed and formal literature, then send only the most interesting materials with compositional unknowns for analysis, keeping it narrow to keep the cost down: a fillet's known composition, or a similar species, can point to what is worth testing. Then translate composition into function, from secondary data sources first (always start with what is already known, to avoid doubling cost and effort: the research finder lists key peer-reviewed papers for your species), then with selective analysis based on indicative composition, accessibility and supply chain. The quick-glance indicator helps you think about which traits of broad seafood groups might become which types of value, and even business models.
Then decide where to focus first. At the start, time and resources are likely to be limited, so spend them where they will do most to further utilization and valorization, starting with the lowest-hanging fruit. The 100% Prioritization Matrix Tool scores side-stream value chains on six dimensions, from side-stream availability to regulatory complexity, using local data and stakeholder interviews, to give you a shortlist of two or three chains to develop. Drawn as a priority net, a chain that scores high and even is a strong place to start, while big peaks and deep dips show the barriers to fix first. Running it in full with the how-to guide is a deep dive that needs significant data gathering, expertise in policy, regulation, innovation and biology, and strong connectivity in the region; the interactive 100% Prioritization Matrix Tool gives you a quicker, less in-depth shot at it. The same framework gave very different answers in Scotland, Oregon and Sisimiut, because local context decides. As the Great Lakes showed, adapt the principles rather than copying a structure, invest in research first, and build trust before infrastructure.
Finally, identify your early 100% Champions. Some form of full utilization is most likely already happening in your ecosystem: it may be small-scale, not well known or considered fairly low value, but almost every ecosystem has a clear first example of 100% in action, from Lýsi, making cod liver oil in Reykjavík since 1938, long before the cluster, to AlaSkins, an early champion in Alaska whose founder, Sara Erickson, tells her own story, the Reclaim Cooperative in Oregon, which grew out of a yak hide tanner trialling fish skin leather in a school education project, and full utilization for agricultural compost on Indigenous reservations around the Great Lakes. Highlighting and lifting them up builds momentum from the grassroots, connecting with your ecosystem's own context and heritage as well as a future growth opportunity. Finding them is as much relationship building as knowledge building, so get out and connect with them: processors, entrepreneurs and fisheries can all be great sources of 100% Champions. They lead straight into chapter 4, showcasing the 100% opportunity in your own ecosystem, its existing champions and the next steps to create more value and less waste.