
Prioritizing your side streams
How to run the 100% Prioritization Matrix Tool in your own ecosystem.
At a glance
- Who it's for: seafood ecosystem builders of any kind, whether working to unlock side-stream value at the company, regional, or policy level.
- What you'll need: existing landings, production, and industry data, plus interviews with the people directly involved in your seafood industry.
- What it produces: a six-axis score for each candidate side-stream-to-end-product chain, and a ranked shortlist of 2-3 chains to explore further.
- Support: the tool can be run independently by ecosystem leaders, but its use can be accelerated with support from expert seafood utilization consultants, like the Iceland Ocean Cluster.
Leaders of emerging 100% utilization ecosystems face a common early challenge: identifying which seafood side-stream value chains to pursue in their local context. This tool helps them avoid chasing high-value end products that don't match local supply realities or defaulting to low-value uses that underutilize local side-streams.
The Prioritization Matrix tool supports emerging ecosystems in navigating uncertainty, identifying which side-stream-to-end-product chain to prioritize first, and scaling the value creation of the global 100% utilization. It is designed for seafood ecosystem builders of any kind, whether working to unlock side-stream value at the company, regional, or policy level.
The tool can be run independently by ecosystem leaders, but its use can be accelerated with support from expert seafood utilization consultants, like the Iceland Ocean Cluster.
How the Prioritization Matrix works
While total seafood production in each geography seems like the logical starting point for identifying priority side-stream value chains, it can be misleading. Opportunity depends on a broader view of the entire side-stream landscape. This means zooming from total landings into local retention (what is processed onshore rather than discarded at sea), to biomass split (species-specific yield rates by side-stream type), and finally to composition (what each side-stream is biochemically suited to produce). From there, this tool enables leaders to make prioritization decisions about their region's potential side-stream-to-end-product value chains.
The Side-Stream Prioritization Matrix measures the opportunity of each identified value chain across six dimensions. Existing industry data is combined with insights from stakeholder interviews to produce a ranked shortlist of value chain opportunities to pursue first.
The scoring framework
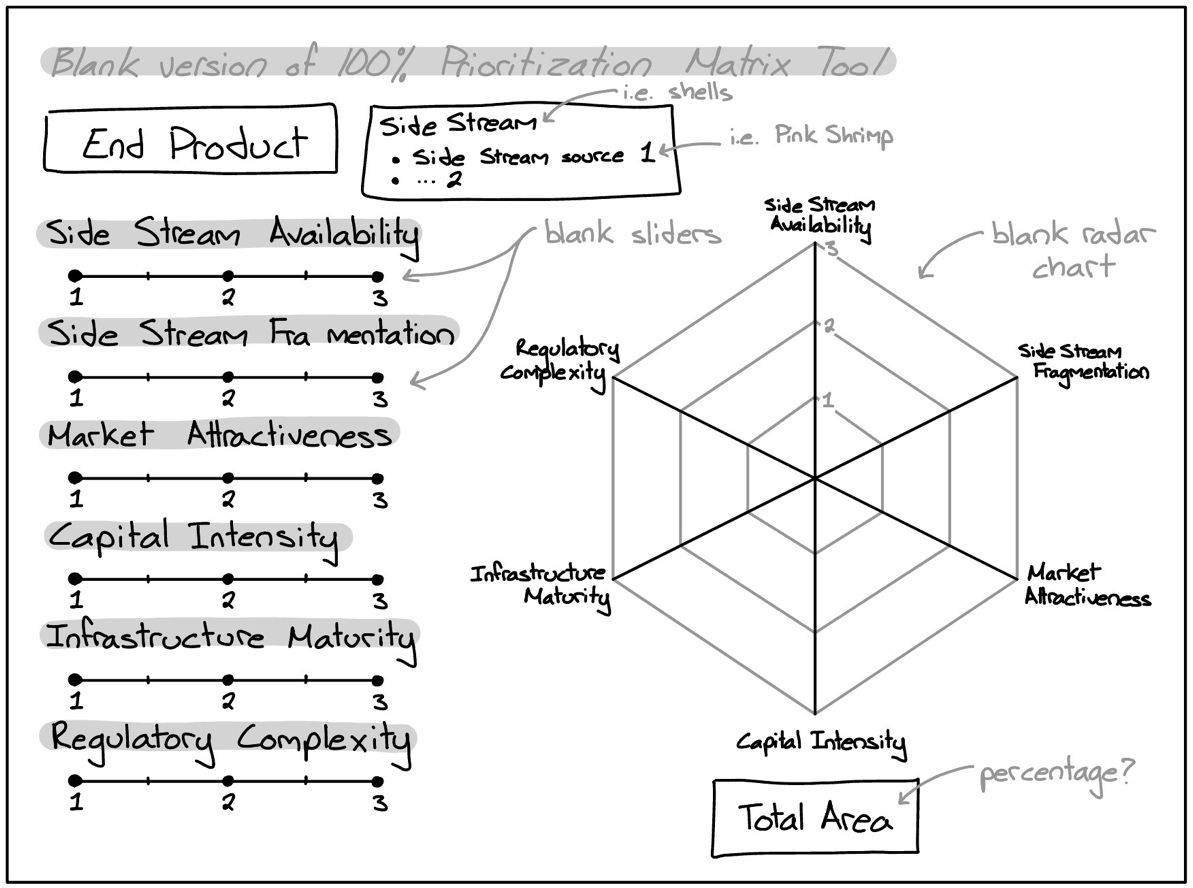
The 100% Prioritization Matrix Tool uses a six-axis radar plot to visualize responses. The total area represents the overall opportunity of a given side-stream-to-end-product chain, and each axis scores one dimension contributing to a value chain's overall valorization opportunity.
- Side-Stream Availability measures the volume and consistency of usable side streams. A high score indicates year-round, consistent volume with low export leakage.
- Side-Stream Fragmentation measures the geographic and supplier dispersion of inputs. A high score indicates centralized, easily aggregated supply.
- Market Attractiveness assesses demand potential and competitive dynamics. A high score indicates top-third, high-margin markets such as medical or pharmaceutical applications.
- Capital Intensity ranks the upfront investment and process complexity required for deployment. A high score indicates modest, SME-friendly entry points.
- Infrastructure Maturity assesses the readiness of local logistics, processing, and storage. A high score indicates industrial-scale producers and full infrastructure already in place.
- Regulatory Complexity measures compliance burdens across jurisdictions. A high score indicates clear standards and fast approval pathways.
Capital Intensity and Infrastructure Maturity can each be split into two sub-scores where ecosystem conditions call for it: Preparatory Processing and Value-Added Processing. The radar plot input then uses a weighted average of the two, with relative weight determined by scorers' judgement.
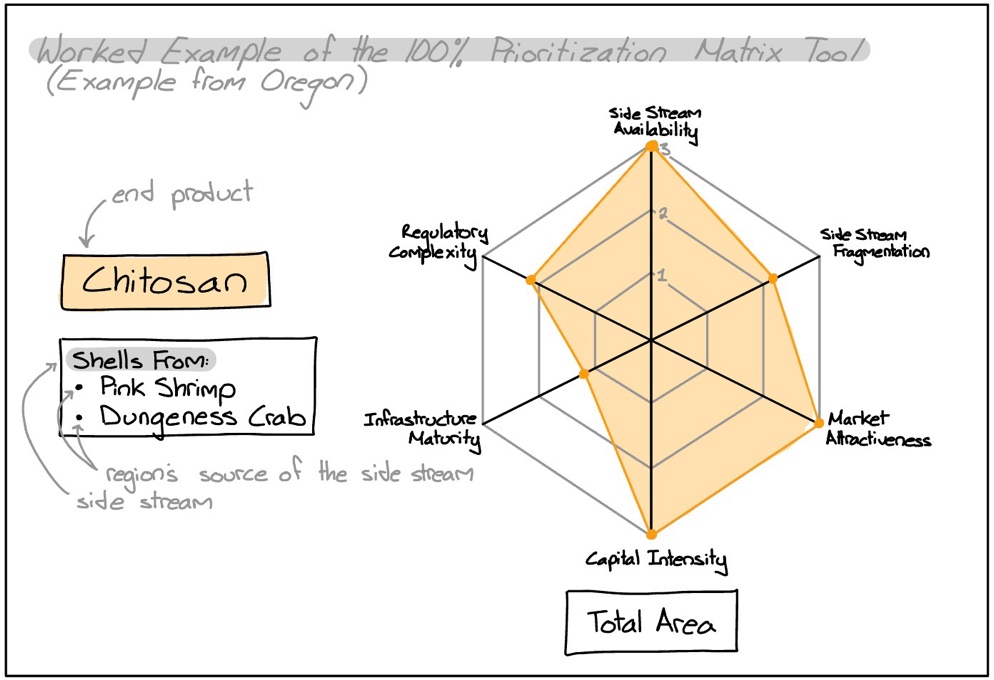
Each dimension is scored 1-3, using the criteria in the Opportunity Scoring Rubric (see Step 3). A score of 1 represents low opportunity, 2 moderate, and 3 high. Axes should be read collectively, as a low score in one area is not disqualifying, but signals where implementation will require the most focus if that value chain is prioritized.
Your 4-step assessment
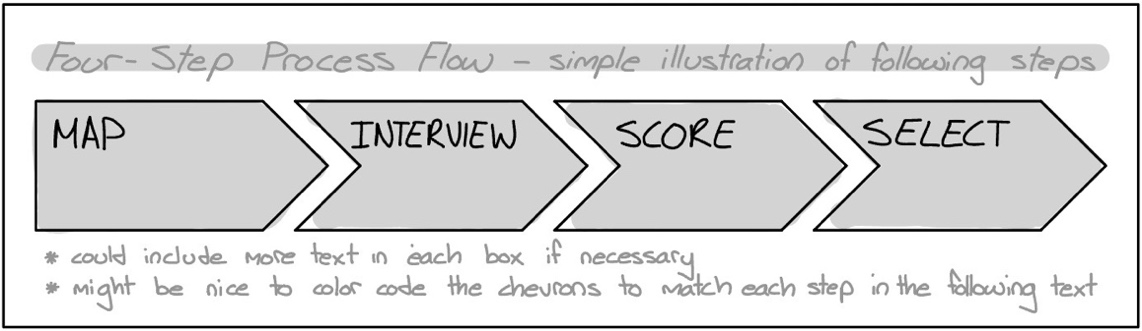
Step 1: Map your seafood ecosystem's side-stream landscape
Goal: Side-stream value chain identification. Move from What seafood is landed? to What side-streams are accessible for value creation?
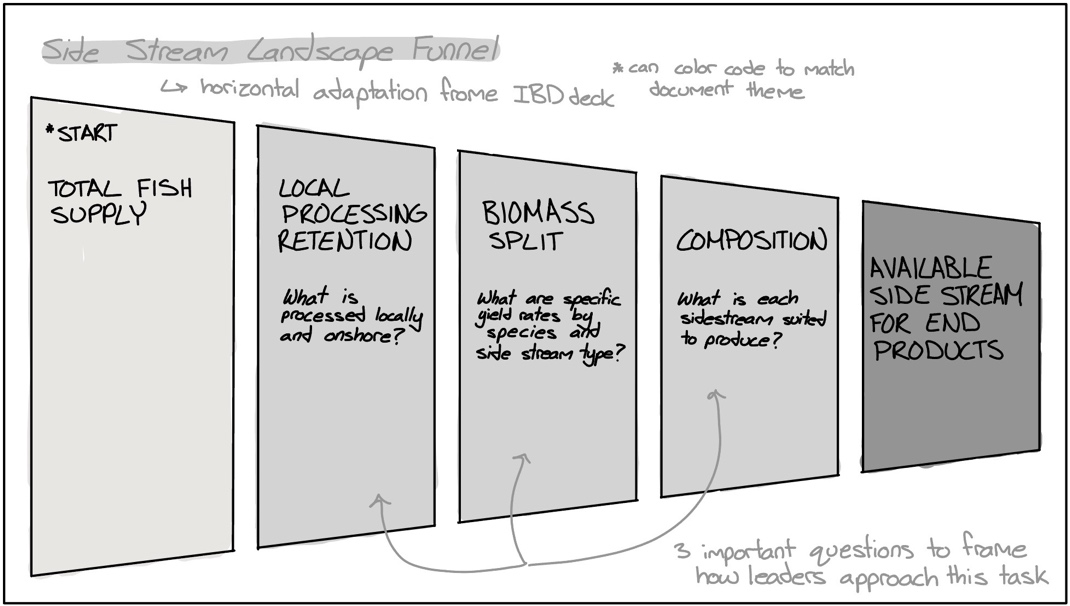
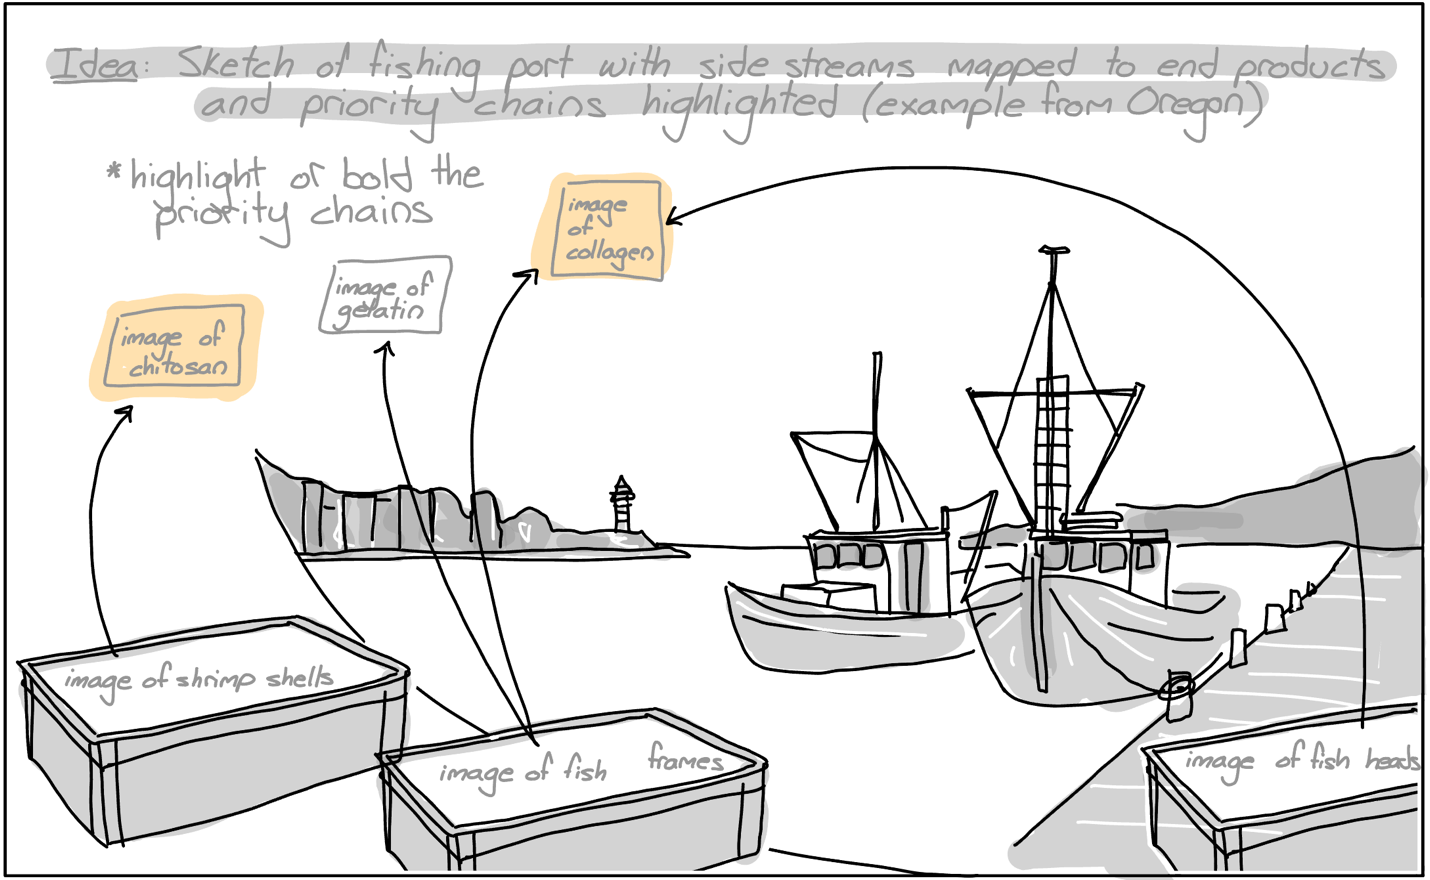
In this step, ecosystem leaders will compile and analyze existing landings, production, and industry data to build a preliminary picture of which side-streams in their seafood industry are worth exploring further. The output will be an initial map of what side-streams are available, what species they come from, and their potential end products (see the example below). This step initiates the data gathering necessary for scoring in Step 3.
See an example: side-streams mapped to end products (Oregon)
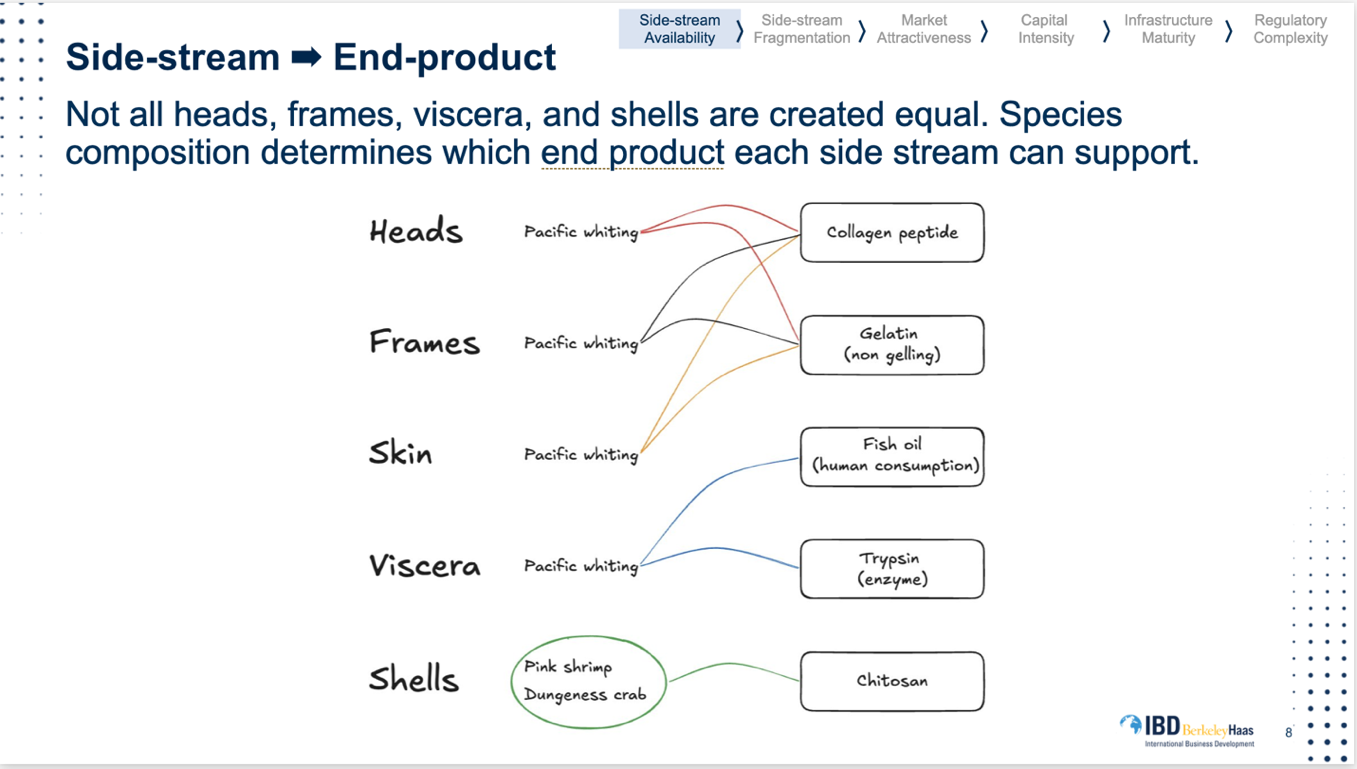
Focus on: Available species and their usable side-stream volumes, biomass splits, and compositions; seasonality trends for each species; existing processing infrastructure and supply chain structure; current side-stream uses.
Flag: The biggest gaps in the available data.
This step is desk-based and can be strengthened by the support of neutral seafood utilization experts like the Iceland Ocean Cluster. It will gather preliminary data and identify the gaps requiring attention in Step 2.
Step 2: Interview relevant stakeholders
Goal: Build understanding of each side-stream-to-end-product value chain identified in Step 1 through interviews with those directly involved in the seafood industry.
Bonus: Build relationships that lay the groundwork for future 100% utilization implementation in this trust-based industry.
This is the most important step, as the information that doesn't exist in any database (handling practices, willingness to supply, and existing relationships) is often what determines which chains are most viable. Ecosystem leaders will use interviews to fill the gaps left by Step 1. On-the-ground presence is essential for finding the right people to speak to and beginning to build the cluster relationships that implementation will depend on.
Talk to: Primary and secondary processors, ingredient makers, entrepreneurs, researchers, and policy makers. Specific organizations will vary by region.
Ask about: Current side-stream handling and separation practices, discard rates, regulatory constraints, transport and processing logistics, cost drivers, market demand and priorities, and anything else unclear after Step 1.
Step 3: Score each value chain candidate
Goal: Translate what was learned in Steps 1 and 2 into a structured, comparable score for each candidate chain.
All the data gathered thus far will be used to score the opportunities that the identified value chains represent. Using the Opportunity Scoring Rubric, each side-stream-to-end-product combination will be assessed and scored on a scale of 1-3 across all six axes.
Open the Opportunity Scoring Rubric
| Criteria | 1 · Low | 2 · Moderate | 3 · High | Note |
|---|---|---|---|---|
| Side Stream Availability | Low volume; unpredictable or heavily exported raw materials | Moderate volume; sufficient but requires coordination to meet thresholds | High, consistent volume; year-round processing; low export leakage | Focus on actual landed volume, not theoretical catch |
| Side Stream Fragmentation | Highly dispersed across many small processors; consolidation would require major new logistics | Some geographic concentration; coordination possible but non-trivial | Centralized supply; single-site or co-located processors; easy to aggregate | High availability + high fragmentation signals infrastructure gap, not lack of opportunity |
| Infrastructure Maturity | No secondary producers; skills must be built or imported | Pilot/small-scale producers; adaptable adjacent equipment | Industrial-scale producers; full infrastructure & expertise in place | Assess similarity of required unit operations to what processors already do |
| Market Attractiveness | Bottom third of value; industrial / agricultural / energy applications | Middle third; standardized pricing; food, cosmetic, nutrition sectors | Top third; high-margin; medical or pharmaceutical use | Higher value → smaller volumes required to be viable |
| Regulatory Complexity | Stringent or unclear rules; multi-agency oversight; clinical/lab validation required | Well-defined; functional claims validation; significant documentation required | Simple safety & hygiene compliance; clear standards; fast approval pathways | Score 1 = most complex; Score 3 = least complex |
| Capital Intensity | Large capex: new plant & specialized equipment; long payback period | Moderate: upgrades or modular units; phased build-out feasible via partnerships | Modest: retrofits or small-scale equipment; SME-friendly entry point | Score 1 = most capital-intensive; Score 3 = least |
Higher total score = greater near-term opportunity. Evaluate criteria in combination; no single dimension is disqualifying. Side stream availability and fragmentation should be read together: high volume + high fragmentation signals an infrastructure gap, not absence of opportunity.
This step is most effective when done collaboratively between at least two people, ideally one with technical processing knowledge and one with local knowledge, to ensure that the score reflects the full picture. Practitioner insight best enables matching of real conditions to the correct score descriptions. If a certain dimension falls between two criteria, a partial score (i.e., 2.5) is appropriate. Support from neutral experts with experience running similar assessments, like the Iceland Ocean Cluster, can strengthen scoring.
Step 4: Select the priority chains
Goal: Identify the 2-3 chains worth carrying into deeper business model development.
Look for: Highest overall scores paired with relative consistency across axes.
Flag: Low scores on any axes, especially if the same low score is identified across value chains.
Candidate chains will be compared side by side using the radar plot outputs from Step 3 (see the blank template above). The chain with the highest overall score is a strong starting point but should not be the automatic selection. Ecosystem leaders should prioritize chains that score high overall and consistently across axes.
A chain with a few very high scores and several low ones signals specific barriers that need to be addressed before a valorization opportunity is viable; not a strong near-term opportunity. Low scores on individual axes are important data points to collect. They identify where the ecosystem needs the most attention in building long-term strategy.
Output: Ranked shortlist of 2-3 chains to explore further, not a final decision.
Your next steps
With priority chains selected, the real work begins. Ecosystem leaders should now move into active research and development around each chain, convening the processors, scientists, regulators, innovators, and logistics partners whose collaboration will determine what is buildable in their context. Here the assessment transitions from prioritization to action.
The groundwork for this work is already laid. The stakeholder relationships built through Steps 1 and 2 are not just inputs to the scoring process; they are the foundation of the ecosystem itself. The conversations started during this assessment will drive product development, supply agreements, and regulatory navigation going forward.
The 100% Prioritization Matrix Tool does not produce a finished strategy. It produces a clear, locally grounded starting point, and the foundation of your 100% seafood utilization ecosystem.
The 100% Prioritization Matrix Tool was developed in partnership between the Iceland Ocean Cluster, Business Iceland, and an International Business Development team from the UC Berkeley Haas School of Business.