Assessing your ecosystem readiness
How to run the ecosystem readiness survey with stakeholders across your own seafood ecosystem.
At a glance
- Who it's for: ecosystem leaders who want to replicate, run, and evaluate the survey independently in their own region. External neutral support can strengthen the process and help ensure unbiased results.
- What it measures: the readiness of a seafood ecosystem for a 100% utilization cluster, across seven dimensions.
- What you'll need: a diverse pool of respondents from across the region's seafood ecosystem, and the survey, which is provided in full in Step 2.
- What it produces: a radar plot of your ecosystem's readiness, and a clear picture of where the biggest barriers lie and where to focus time and resources first.
What the assessment measures
Through responses from relevant industry stakeholders, this survey tool assesses the readiness of an ecosystem for a 100% utilization cluster across seven dimensions, each reflecting a different condition that determines whether the ecosystem can support effective cluster development. This guide enables ecosystem leaders to fully replicate, run, and evaluate the results of this survey independently, although external neutral support can strengthen the process and help ensure unbiased results.
- Policy Alignment measures how well current policies support better use of seafood resources. A high score indicates a clear, enabling policy environment with active incentives for local processing and full utilization.
- Industry Activity measures the breadth and density of seafood-related and adjacent industry in the region. A high score indicates an active ecosystem of producers, processors, and potential end-users already operating locally.
- Research Capacity measures access to technical expertise, scientific knowledge, and innovation support. A high score indicates strong local research infrastructure with established links to industry.
- Local Infrastructure measures the suitability of physical infrastructure for seafood activities. A high score indicates reliable cold chain, harbor access, processing space, and connectivity already in place.
- Value Chain Opportunity measures how clearly concrete opportunities exist to create more value from existing seafood resources. A high score indicates well-identified, underutilized materials with visible market interest.
- Collaboration in Practice measures how much different organizations already work together around seafood utilization. A high score indicates regular cross-sector contact, information sharing, and joint activity already underway.
- Coordination Capacity measures whether an active convening actor exists to bring people together and sustain momentum. A high score indicates a known, trusted coordinator already functioning in the ecosystem.
These seven dimensions, scored and interpreted together, define a seafood ecosystem's readiness to support an effective cluster.
How to run the assessment
Step 1: Identify and invite your respondents
Goal: Build a respondent pool that reflects the full breadth of the region's seafood ecosystem.
The diversity of the respondent pool determines the quality of results. A wide range of roles, perspectives, and levels of involvement produces a more accurate and useful readiness picture than a large pool of similar voices. Ecosystem leaders should avoid the temptation to invite people already in their networks. Forging new connections with stakeholders outside their immediate circle will reduce bias, produce more honest results, and lay the groundwork for the broader ecosystem relationships that 100% ecosystem development will depend on.
Focus on:
- Breadth of role: government, private companies, innovators, researchers, community groups, and NGOs.
- Breadth of involvement: from those directly involved daily to occasional observers and adjacent industry actors.
- Avoiding bias: actively seek out perspectives beyond your existing network, particularly from underrepresented parts of the ecosystem.
It is recommended to open the survey with two screening questions about the respondent's role and level of involvement in the seafood ecosystem. These will directly impact how results are interpreted in Step 3. All respondents will score all seven dimensions but will have varying degrees of experience with each. A diverse pool ensures strong, informed responses across all seven dimensions, making respondent selection as important to the analysis as the responses themselves.
Invite: Government actors, private companies, innovators, researchers, community groups, and NGOs involved in the region's seafood ecosystem.
Gather: Responses from representatives across all categories, with varied levels of involvement within each. Breadth of representation should always take priority over the raw number of responses.
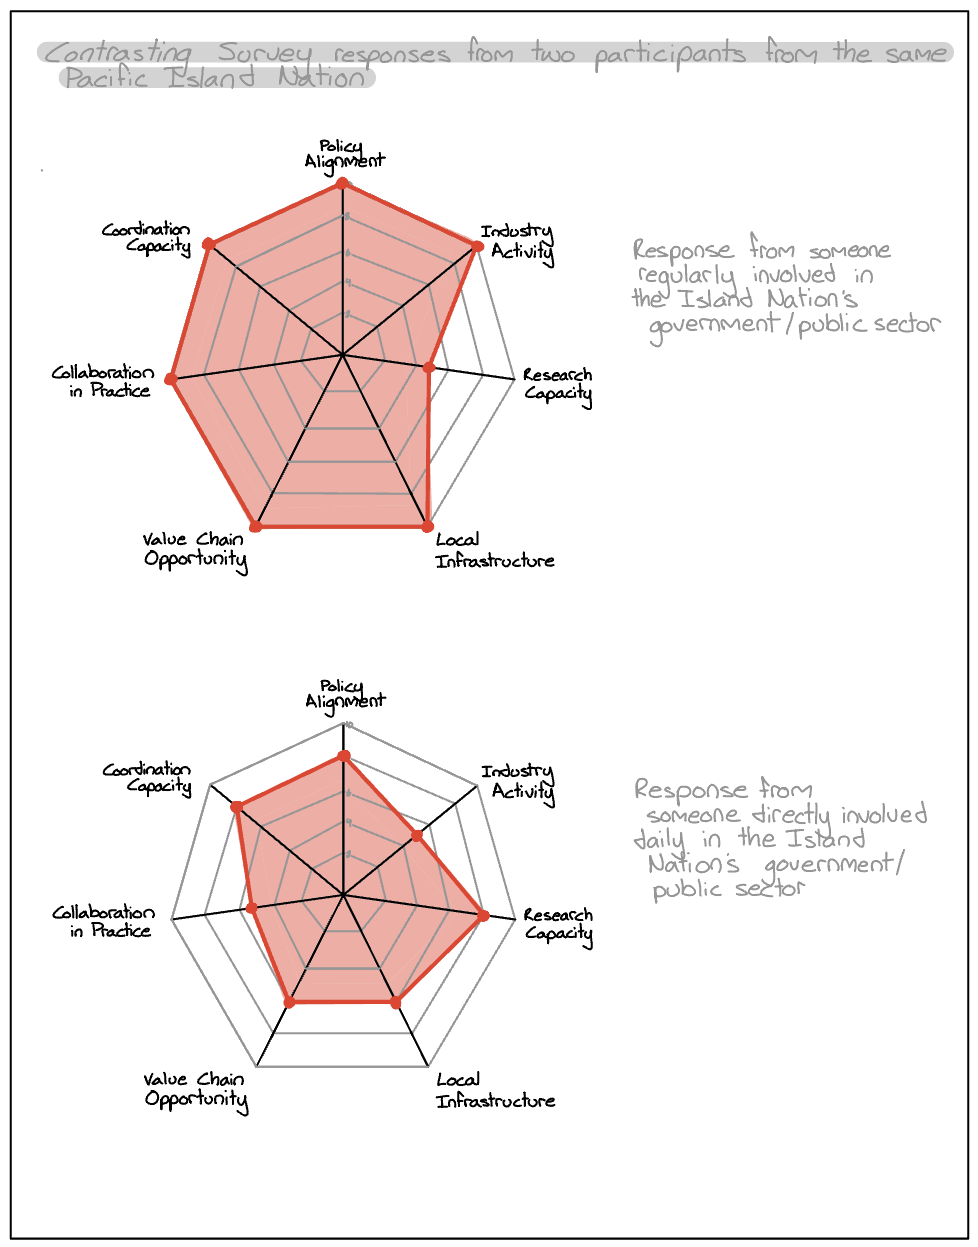
The figure below illustrates why breadth of representation matters. Two respondents within the same ecosystem can produce dramatically different scores across the same seven dimensions based on their unique perspective. A single respondent's score alone is not a readiness assessment, but a reflection of their role, experience, and proximity to different parts of the local seafood ecosystem. A diverse respondent pool helps leaders average scores across a wide range of experiences and expertise, and develop a readiness assessment that best reflects the stage of the ecosystem.
Step 2: Distribute and collect
In this step, respondents score the readiness of each of the seven dimensions through a structured survey. All respondents score all seven dimensions, but certain respondents will have more direct experience in some dimensions than others, which will inform how results are weighted and interpreted in Step 3.
Goal: Gather responses about the readiness of each dimension from the identified respondent pool.
Adapt and implement: The Iceland Ocean Cluster has prepared a survey instrument for this assessment, provided in full below. It can be used as-is or adapted and translated to better fit the local context and respondent pool, and additional questions can be added where local context requires. While this step can be run independently, external neutral expert support can help ensure the process runs efficiently and that results are not inadvertently biased.
Distribute: The survey to the key stakeholders identified in Step 1. Communicate the timeline clearly, allow adequate response time, and follow up with key stakeholders if response rates are low.
Open the full survey: questions, scoring and notes
The following contains all survey questions, scoring guidance, and notes on interpretation. Ecosystem leaders running this assessment independently can use this to recreate the survey in any platform of their choosing. Suggested survey tools include Qualtrics, Microsoft Forms, or Google Forms.
Each survey question scores one dimension of the assessment, with detailed prompting questions and a clear description of what a high score indicates. Respondents are also given space to explain their score and the reasoning behind it. At the end of the survey, two open-ended questions ask respondents to identify the biggest barriers to seafood utilization and collaboration in their region, and whether anything important was missing. These qualitative responses often surface the most important insights and should be read carefully alongside the scores in Step 3. Respondents are also invited to share their contact information for future follow-up if they are comfortable doing so.
The survey: How does your seafood sector work together?
Fish feeds billions of people, sustains coastal communities, and sits at the heart of many food cultures. Yet we still throw away a huge amount of what we catch and farm, while the value that is lost could become food, medicine, materials or energy. The Iceland Ocean Cluster works globally around a simple but ambitious idea: that we should use 100% of the seafood we catch and farm. Making that happen requires connection between fishers, processors, researchers, governments, entrepreneurs and industries. With this survey, our aim is to build a picture of how seafood sectors in different regions around the world collaborate and what makes it work. That is where you come in. It takes about 15 minutes to complete this survey. Responses are confidential and results will be shared publicly in aggregated analysis that will be available on our website by the end of 2026.
Thank you for taking the time. Your perspective genuinely matters. For further information, contact oceancluster@oceancluster.is
TLDR: We want to understand how the seafood sector in your region works and who collaborates with whom, to help build a global picture of what makes better fish utilisation possible. Takes 15 minutes.
Section 1: About you
- Your role? A data validation prompt using the following options is suggested: Government / public sector · Private company (processing, fishing, services) · Community group / NGO · Research / education · Other
- Your level of involvement in the seafood sector? A data validation prompt using the following options is suggested: Directly involved daily · Regularly involved · Occasionally involved · Indirect / observer
- Which country or region are you answering about? A data validation prompt is suggested.
Assessment questions
Each dimension is scored on a scale from 0 to 10 (required), followed by an optional comment.
- Policy alignment How well do current policies support better use of seafood resources in your region? Consider: landing obligations, bycatch rules, aquaculture regulations, incentives for local processing, quota structures, or national strategies for full utilisation of marine/aquatique resources. A strong policy environment makes it easier (legally and economically) to use more of what is caught or farmed, rather than discarding it. 0 · Not on the agenda10 · Actively supported by policy
- Please add any example, explanation, or comment on policy alignment.
- Industry activity How much industry activity exists in your region, within and beyond seafood? Consider: fishing fleets, fish farms, processors, exporters, but also potential end-users of seafood-derived materials: food and beverage companies, cosmetics, pharmaceuticals, chemicals, animal feed, or other industries that could become partners in utilising more of what the sea produces. 0 · Little activity10 · Established and active
- Please add any example, explanation, or comment on the local industry.
- Research capacity How easy is it to access technical expertise, scientific knowledge, or research support for seafood-related work in your region? Consider: universities, applied research institutes, local labs, product development support, or technical advisors. This includes support for processing innovation, aquaculture improvement, or finding new uses for materials that are currently discarded. 0 · Little or no access10 · Readily available and engaged
- Please add any example, explanation, or comment on research capacity.
- Local infrastructure How suitable is the local infrastructure for seafood activities? Consider: cold chain and storage, harbour access and reliability, transport between landing or farming sites, processing space, water supply, electricity and internet connectivity. 0 · Major gaps remain10 · Reliable and fit for purpose
- Please add any example, explanation, or comment on infrastructure.
- Value chain opportunity Based on your experience, how clearly can you identify opportunities to create more value from existing seafood resources in your region? Consider: materials that are currently discarded or underused (such as trimmings, shells, viscera, bycatch, or whole farmed species), known volumes and locations, existing product ideas, or visible market interest. The clearer and more concrete the opportunity, the higher the score. 0 · Not yet identified10 · Well mapped / ready to act on
- Please add any example, explanation, or comment on value chain opportunity.
- Collaboration in practice How much do different organisations already work together in practice around seafood utilisation? Consider: whether fishers, processors, aquaculture operators, government, researchers, entrepreneurs, and communities have regular contact, share information, or run joint projects, particularly around making better use of available resources. 0 · Working mostly in isolation10 · Regular & productive collaboration
- Please add any example, explanation, or comment on collaboration in practice.
- Coordination capacity Is there a person, team, or organisation that actively brings people together and follows up on action around seafood development in your region? Consider: a known contact point, a ministry team, an industry body, a cluster organisation, or any actor that convenes meetings, connects people across sectors, and keeps momentum going. 0 · No clear point of contact10 · Active and recognised coordinator
- Please add any example, explanation, or comment on coordination capacity.
Final remarks
- What do you see as the single biggest barrier to better seafood utilisation or stronger collaboration in your region?
- Is there anything important that this survey did not capture?
Follow-up (optional)
- If you are open to a follow-up conversation, please share your name, role, and preferred contact details, and feel free to mention any topics you would particularly like to discuss.
Thank you
Thank you for taking the time to share your perspective. Your input is truly appreciated and will help shape this work. If you would like to continue the conversation, we would be glad to hear from you.
- The Iceland Ocean Cluster team
Step 3: Visualize your results
Goal: Display aggregated survey results in a format that makes patterns, strengths, and gaps immediately readable.
In this step, ecosystem leaders will compile and visualize the quantitative survey output. Support from a data analysis professional can aid in producing clean visuals and preparing results for interpretation in Step 4.
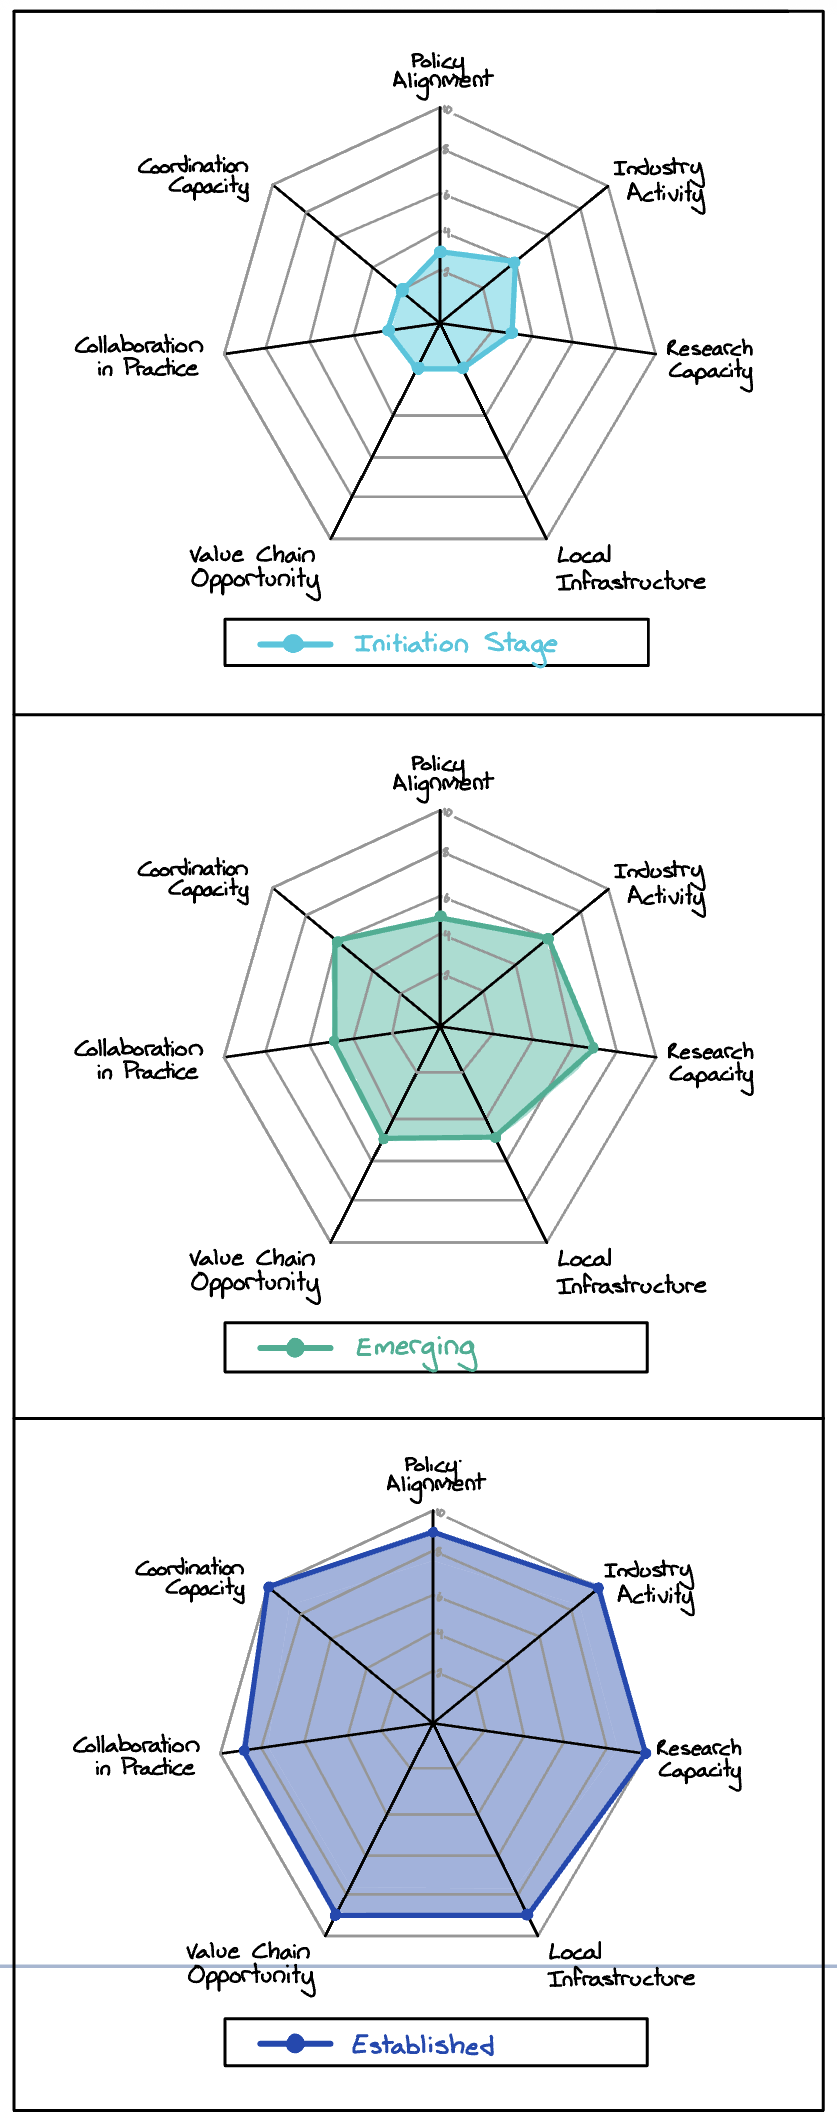
A radar plot is the recommended visualization tool for this assessment. Each axis represents one of the seven dimensions, with a thick-line average, optionally overlaid by thin-line individual scores labeled by respondent type and level of involvement. The total area of the radar plot provides a useful overall readiness indicator and a helpful starting point, but the shape and distribution of scores across dimensions matters far more than the total area alone.
See examples: survey results at three stages of readiness
Step 4: Interpretation and next steps
Goal: Translate the radar plot and qualitative context into a clear picture of ecosystem readiness and a prioritized set of next steps.
There is no single score that determines whether a seafood ecosystem is ready for a 100% utilization cluster. What matters is the full picture read in context, including profile shape, the qualitative responses behind individual scores, and the patterns that emerge. As ecosystem leaders analyze their results, they should:
- Read the profile shape. A strong overall profile with one weak dimension tells a different story than a uniformly moderate profile. Identify the strongest dimensions as the foundation to build on, and the weakest as the areas requiring investment or relationship-building before cluster activity can scale.
- Understand who is behind each score. The role and involvement screening questions allow ecosystem leaders to see not just the numeric scores, but who gave them and why. A low infrastructure score from someone directly involved in processing tells a different story than a diverging score from an occasional observer. One isn't more important than another, but the divergence itself provides important information about how different stakeholder groups experience the same ecosystem.
- Read scores in context, not absolutely. The additional context provided within each survey question, alongside the final remarks section, will be especially valuable here. Read these qualitative responses as added texture to the scores, useful for identifying specific barriers within broader categories, challenges that cut across multiple dimensions, and issues that will require the most attention in ecosystem development.
- Identify priorities. The profile should help ecosystem leaders identify which dimensions are already strong, which could use strengthening, and which require the most immediate attention. The qualitative context will help surface which challenge dimensions the region is best positioned to address first, and who may be able to help.
This interpretation gives seafood ecosystem leaders a clear picture of how ready their region is to support a cluster, where the biggest barriers lie, and where to focus time and resources first.
Pitfalls to avoid
- Inviting only people already in your network. It's the easy option, but it biases the results. Seek out voices from parts of the ecosystem you don't yet know.
- Overlooking companies that don't see themselves as "blue". Many businesses already connected to the blue economy wouldn't describe themselves that way, so they won't come to you on their own.
- Counting responses instead of perspectives. A large pool of similar voices gives a less accurate picture than a smaller one that spans roles, sectors and levels of involvement.
- Reading one person's scores as your ecosystem's readiness. Each respondent's scores reflect their own role and experience. The real picture comes from many perspectives together.
- Judging readiness by the total alone. The shape of the profile, the comments behind the scores and who gave them matter far more than the overall number.
- Looking for one answer for a whole region. In the Pacific Islands, readiness differed from nation to nation, so a single shared regional cluster would have been impractical.
The ecosystem readiness survey was prepared by the Iceland Ocean Cluster · Individual assessment for ecosystem readiness